Net Worth, the FirePath wayNettovermögen, auf die FirePath-Art
The Net Worth screen with all the bells and whistles: heading grouping, drag-sort, per-owner sub-sections, the period-change chip, and the automatic monthly snapshot system that powers the history chart.Der Nettovermögen-Bildschirm mit allem Drum und Dran: Gruppierung nach Überschriften, Drag-Sortierung, Unterabschnitte pro Eigentümer, der Zeitraum-Änderungs-Chip und das automatische Monatsaufnahme-System, das das Verlaufsdiagramm antreibt.
{# Hero image is rendered twice — once for each locale — and one is
hidden by the lang toggle. The DE copy lives in a /de/ subfolder
under the same slug; we strip the trailing "hero.png" and re-add
"de/hero.png" so we don't need a custom template filter. Pattern
assumes hero_image_filename is always "/hero.png", which is
the convention enforced by the seed migrations. #}
Quick start
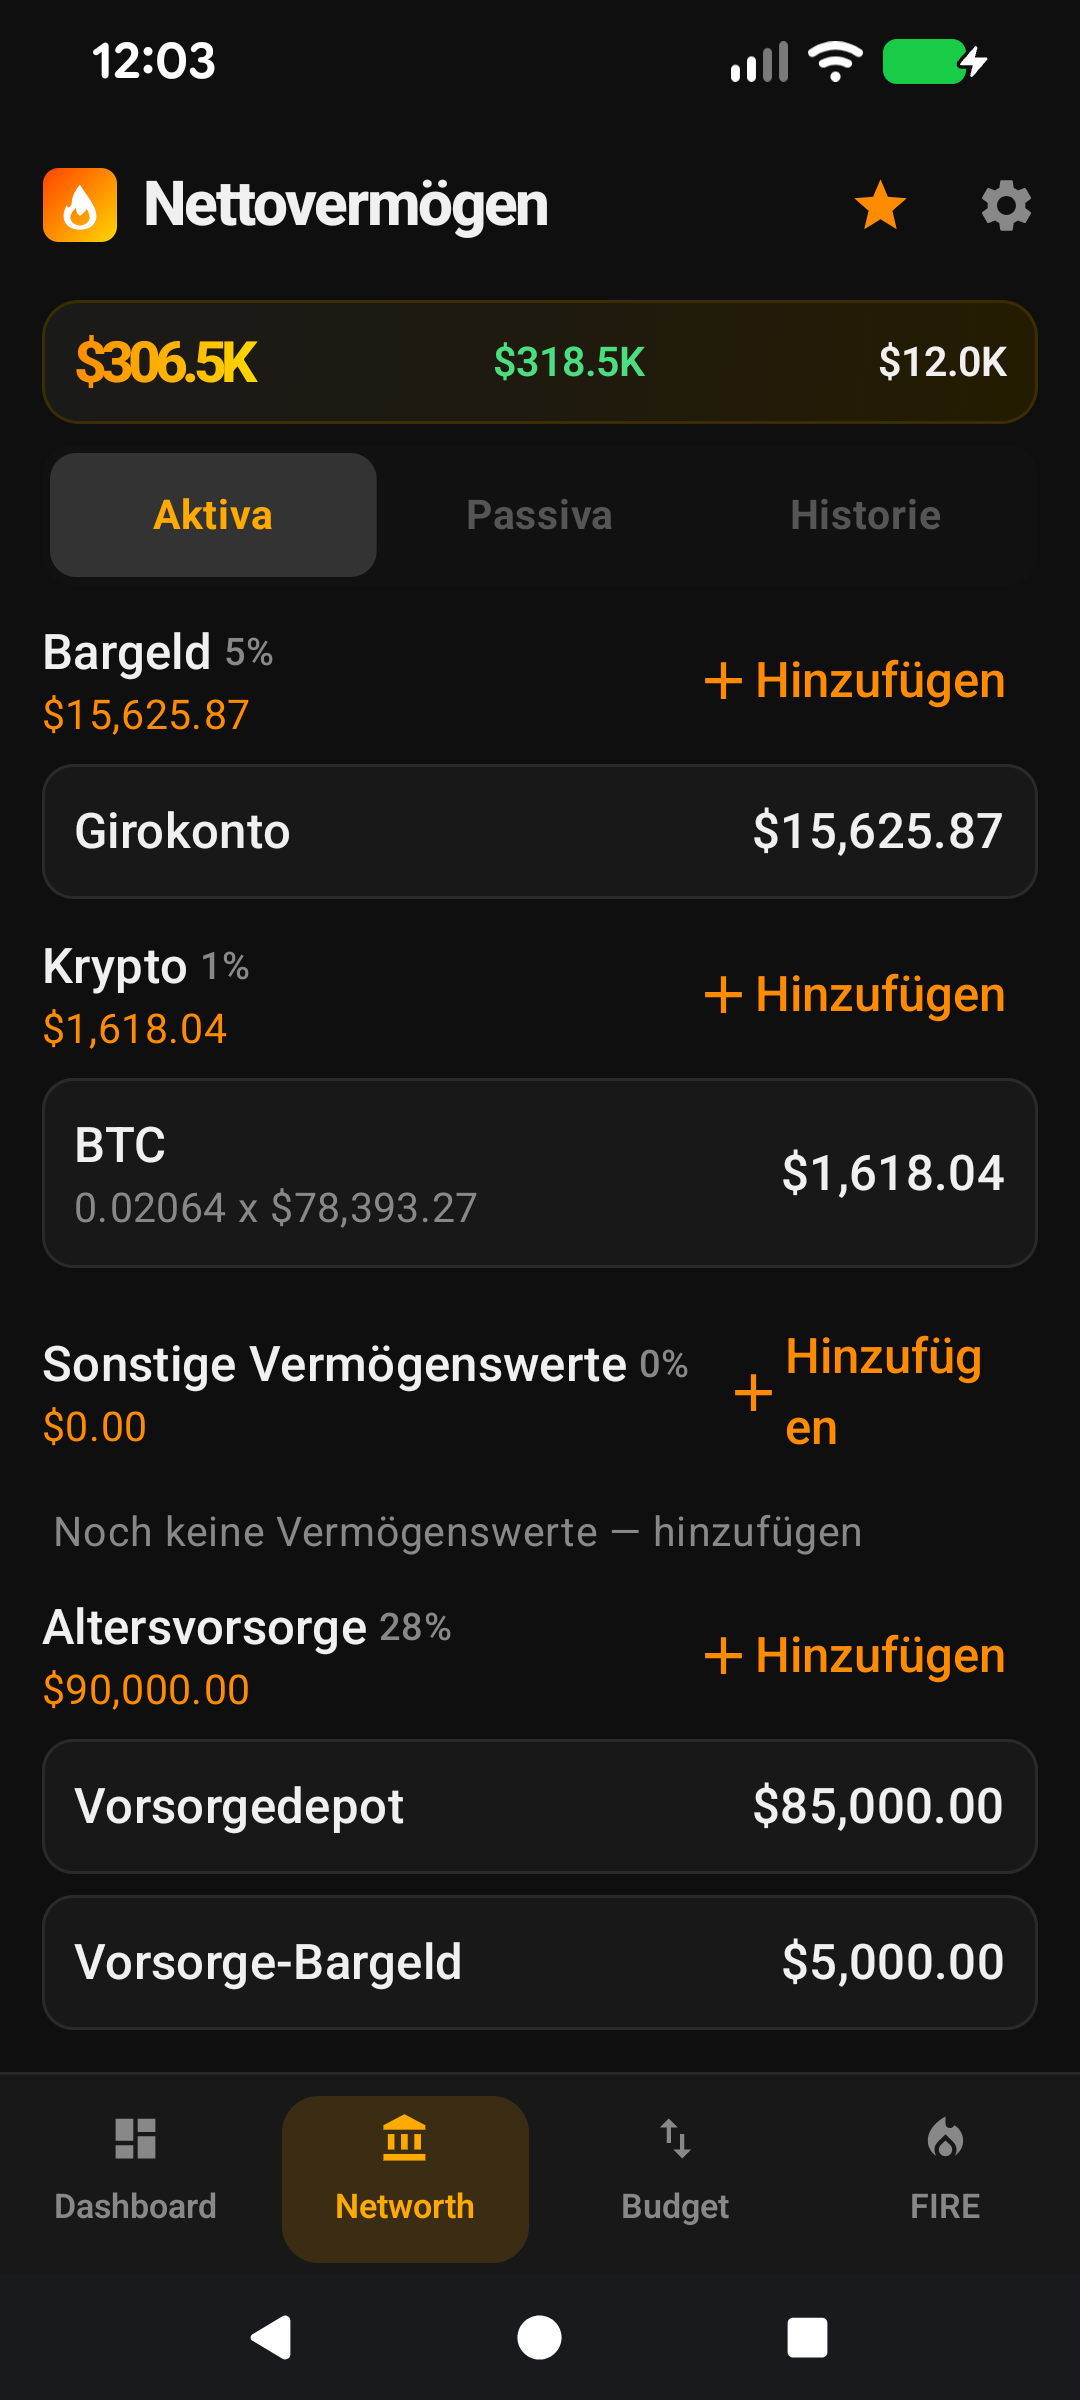
The Net Worth screen lists every asset and liability you've added, grouped by heading. Three tabs at the top switch between Assets, Liabilities, and History.
Assets tab — every asset grouped by heading (Investments, Super, Property, Cash, etc.). Tap a row to edit it.
Liabilities tab — same layout for debts.
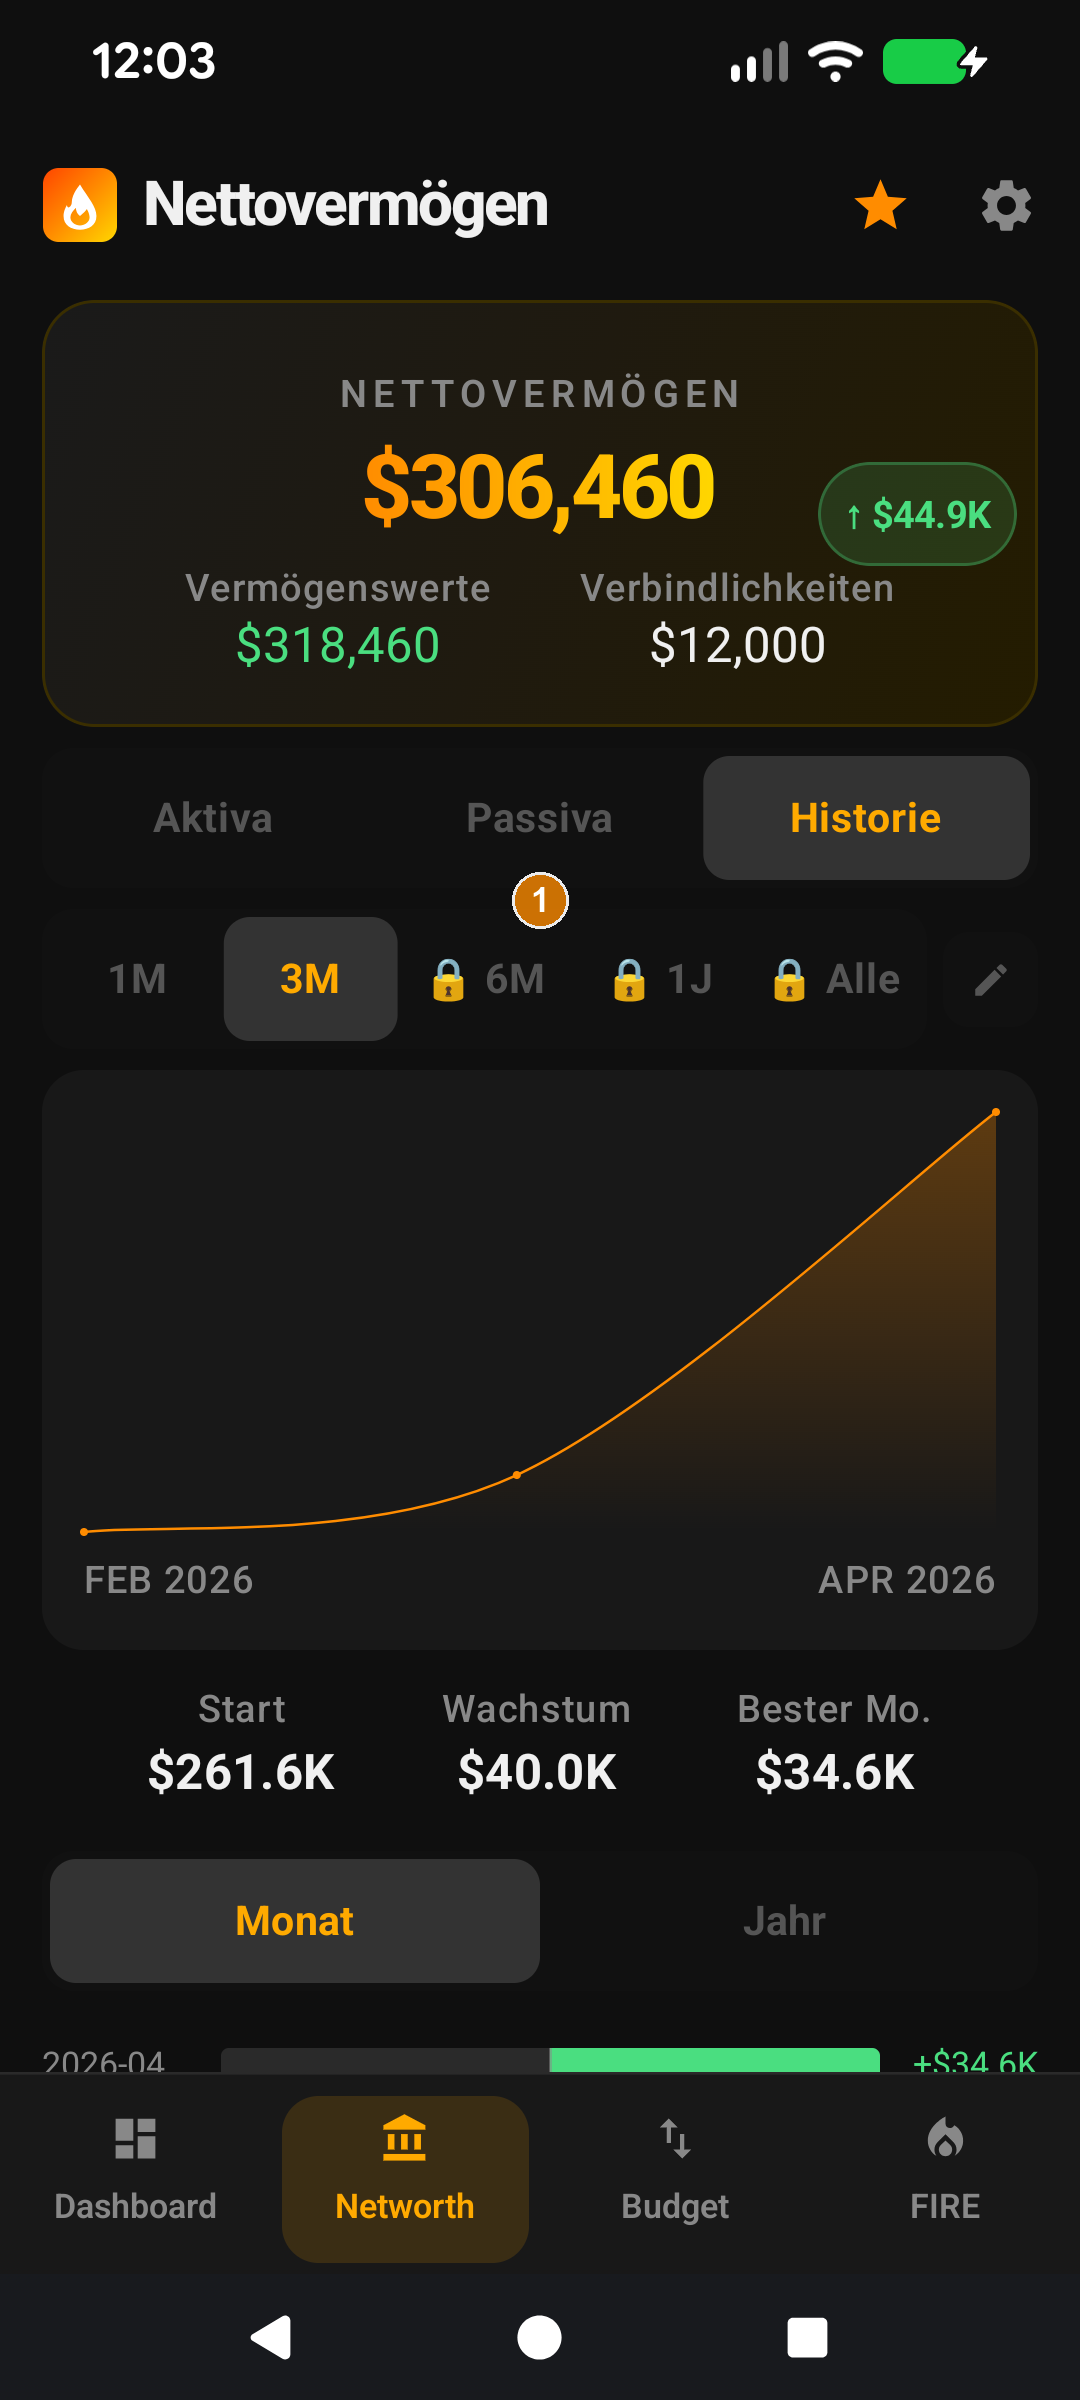
History tab — a chart of your net worth over time, with 1m / 3m / 6m / 1y / All range selectors.
The big number at the top is the total for whichever tab you're on. The small chip next to it shows the change.
+ button adds a new asset or liability depending on which tab you're on.
The rest of this guide is for users who want to tune the screen. If you're happy with the defaults, you can stop here — everything below is optional customisation.
Going deeper
Heading grouping
① Assets tab. ② Liabilities tab. ③ History tab.
Every asset has a heading — Investments, Super, Property, Cash, Crypto, and more. Assets with the same heading group into a collapsible section with a subtotal. Liabilities work the same way. This structure is the spine of how net worth is organised in FirePath.
You control the headings in Settings → App Lists → Asset Headings (or Liability Headings). Hide a heading and the assets are still saved; they just stop showing up in lists and totals until you un-hide. Reorder the list to put your most-used headings first. The built-in headings can't be renamed or deleted, but you can always add your own — custom headings you've created are fully renameable and deletable. Renaming a custom heading cascades automatically: every asset sitting under the old name gets updated so nothing is left orphaned.
Drag-sort within a heading
① Long-press to pick up (haptic). ② Drag up or down. ③ Release to drop.
Long-press an asset row and drag to reorder it within its heading. The order is persisted per-asset via a sort_order column — so your preferred order sticks across sessions and devices. Dragging across headings is not allowed; change the heading via the edit screen instead.
The drag handle shows on the right edge of each row only while the section is expanded. Haptic feedback fires at pickup and drop to confirm the action.
Per-owner sub-sections
① Heading with owner-split enabled. ② Owner sub-heading with subtotal. ③ Rows belonging to that owner.
If you're tracking net worth as a couple or household, FirePath can split individual headings by owner. First, add each person under Settings → App Lists → Owners. Then open Settings → App Lists → Asset Headings (or Liability Headings) and tap the heading you want to split — there's a "split by owner" toggle on each one. The toggle is per-heading, so you might split Super and Investments (where accounts are individually owned) but leave Property and Cash un-split (shared household assets).
The result: inside each opted-in heading, you see a mini sub-heading per owner with a subtotal, then the assets belonging to that owner. Assets with no owner assigned fall into an Unassigned group at the end.
This is one of FirePath's most-loved features for families. The split is display-only — all totals still roll up to the household figure. Rename an owner later and the rename cascades through every asset, liability, income, and expense referencing them.
The period-change chip
① Period chip cycles 1m → 3m → 6m → 12m based on available history.
Just below the tab row (Assets / Liabilities / History), a small chip shows how much your net worth has moved in the recent period — green when it's up, red when it's down. The chip is smarter here than on the Dashboard: it follows the tab, and on the History tab it also follows the range selector.
Assets / Liabilities tab — always 1-month change
History tab, 1m range — 1-month change
History tab, 3m / 6m / 1y range — 3 / 6 / 12 month change (walks back through your snapshots to find the oldest one within that window)
History tab, All range — no chip (the delta from your first-ever snapshot isn't useful at a glance)
If you've only been using FirePath for 4 months, the 6-month range still shows a chip — it uses the oldest snapshot available (4m) and labels itself accordingly.
The monthly snapshot system — set-and-forget tracking
This is the feature that turns FirePath from "a portfolio calculator" into a long-term wealth tracker. Every month, the app silently writes a snapshot of your full financial picture — Total NW, Investment NW, total assets, total liabilities, income, expenses, derived figures. Over time these snapshots become your history chart and drive every comparison the app does (the monthly-change chip, the period chips, the progress bars).
You don't do anything. Once your assets and liabilities are entered, FirePath handles the rest:
Prices refresh automatically every 15 minutes while the app is open, plus a periodic background worker when it's closed (premium: Auto-pricing). Ticker-backed holdings stay current without you tapping Fetch All.
Snapshots write automatically when the app opens in a new calendar month, and when the background price worker fires successfully. Your history chart builds itself.
All totals recompute automatically whenever any underlying value changes — asset balances, liability balances, quantities, prices, flags. No "recalculate" button; it's always live.
Snapshots live on your device. Enable Google Drive auto-backup (premium) and they get encrypted-replicated there daily too.
What if I don't open the app for a month?
Honest answer: Android gets aggressive about suspending background work for apps that haven't been opened in a while. If you don't open FirePath for ~5-7 days straight, the periodic price-fetch worker may stop firing (Doze mode, App Standby, and manufacturer optimisations on Xiaomi / Huawei in particular). In that case:
Your asset prices won't have refreshed in the background — they'll update next time you open the app.
A month-end snapshot may have been missed — the app writes the next snapshot when you eventually reopen, using current values for the current month. Last month's month-end snapshot is gone.
Three ways to avoid this:
Open the app at least once a week. 10 seconds to glance at the Dashboard keeps the background worker happily alive.
Add the home-screen widget. It refreshes every 4 hours, which wakes the app briefly and keeps the worker registered.
If you miss a month and want the chart to be complete, add a historical entry manually from the Net Worth → History tab. You pick the year-month and enter the net-worth value; it merges into the snapshot series.
Manual historical entry
① Monthly auto-snapshots. ② Manual historical entries you've added. ③ Period chips: 1m / 3m / 6m / 1y / All.
Didn't discover FirePath until you were already 3 years into tracking? The History tab has a "Add historical entry" button that lets you punch in a net-worth figure for any past year-month. These manual entries merge into the snapshot series and render on the chart. If you have Track Both Net Worths enabled, you can enter both Total and Investment NW; otherwise you only fill the active one and the other column is backfilled to match.
Month vs Annual change bars
Below the history chart sits a list of change bars — one per period, green for gains, red for losses. The chip above lets you flip between Month (one bar per snapshot interval, e.g. 2026-03) and Annual (one bar per calendar year, with the current year shown as 2026 YTD). Annual is the quickest way to answer "how did 2024 compare to 2025?" at a glance.
Sparse-data note: a year shows the sum of changes between snapshots whose later end-date falls in that year. If your snapshot history doesn't span a full calendar year for some bar, that bar represents the partial span you actually have — the Month view remains the finer-grained source of truth.
Include in Investment NW (on every asset)
Each asset has an Include in Investment Net Worth toggle. On by default. Turn it off for personal-use items (primary residence, car, collectibles) that you don't want counted in your Investment NW.
This flag also controls whether the asset is eligible to contribute to the FIRE calculator's projection — because FIRE is fundamentally about what can fund your retirement, not what you happen to own.
Make it yours — Settings that affect this screen
Asset Headings and Liability Headings — Settings → App Lists. The built-in headings can be reordered or hidden. To use a name the app doesn't ship with, add your own — your custom headings can be renamed and deleted freely.
Investment Types — Settings → App Lists → Investment Types. The list of asset types the app ships with (Stock, ETF, Crypto, Managed Fund, Property, Cash, Bullion, Other). Reorder or hide the built-ins; add your own types for unusual holdings (e.g. "Angel investment", "Private Equity", "Art"). Custom types are fully renameable.
Exchanges — Settings → App Lists → Exchanges. Drives which stock markets appear on the Add Asset screen for ticker-backed holdings (ASX, US, LSE, EU/Xetra, plus virtual exchanges CRYPTO and SPOT for bullion). Hide the ones you don't use; add your own if you trade on a market FirePath doesn't cover out of the box.
Owners — Settings → App Lists → Owners. Add household members here; then each asset/liability can be assigned to one.
Split by owner — each Asset Heading and Liability Heading has its own "split by owner" toggle, so you can mix-and-match. Only active when Owners is enabled and you have ≥2 owners.
Show Total Net Worth / Track Both Net Worths — controls which net-worth number is shown and whether both are stored on every snapshot.
Schnellstart
Der Nettovermögen-Bildschirm listet jeden Vermögenswert und jede Verbindlichkeit auf, die Sie hinzugefügt haben, gruppiert nach Überschrift. Drei Tabs oben wechseln zwischen Vermögenswerten, Verbindlichkeiten und Verlauf.
Vermögenswerte-Tab — jeder Vermögenswert gruppiert nach Überschrift (Investments, Super, Immobilien, Bargeld usw.). Tippen Sie auf eine Zeile, um sie zu bearbeiten.
Verbindlichkeiten-Tab — gleiches Layout für Schulden.
Verlauf-Tab — ein Diagramm Ihres Nettovermögens über die Zeit mit Zeitraum-Auswahl 1m / 3m / 6m / 1J / Alle.
Die große Zahl oben ist die Summe für den Tab, auf dem Sie sich befinden. Der kleine Chip daneben zeigt die Veränderung.
+-Schaltfläche fügt einen neuen Vermögenswert oder eine neue Verbindlichkeit hinzu, je nachdem, auf welchem Tab Sie sich befinden.
Der Rest dieser Anleitung ist für Nutzer, die den Bildschirm anpassen möchten. Wenn Sie mit den Standardeinstellungen zufrieden sind, können Sie hier aufhören — alles unten ist optionale Anpassung.
Tiefer eintauchen
Gruppierung nach Überschrift
① Vermögenswerte-Tab. ② Verbindlichkeiten-Tab. ③ Verlauf-Tab.
Jeder Vermögenswert hat eine Überschrift — Investments, Super, Immobilien, Bargeld, Krypto und mehr. Vermögenswerte mit derselben Überschrift werden in einem einklappbaren Abschnitt mit Zwischensumme gruppiert. Verbindlichkeiten funktionieren genauso. Diese Struktur ist das Rückgrat dafür, wie das Nettovermögen in FirePath organisiert ist.
Sie steuern die Überschriften unter Einstellungen → App-Listen → Vermögensüberschriften (oder Verbindlichkeitsüberschriften). Wenn Sie eine Überschrift ausblenden, bleiben die Vermögenswerte gespeichert; sie erscheinen nur nicht mehr in Listen und Summen, bis Sie sie wieder einblenden. Ordnen Sie die Liste neu, um Ihre am häufigsten genutzten Überschriften zuerst zu platzieren. Die integrierten Überschriften können nicht umbenannt oder gelöscht werden, aber Sie können jederzeit eigene hinzufügen — benutzerdefinierte Überschriften, die Sie erstellt haben, sind vollständig umbenennbar und löschbar. Das Umbenennen einer benutzerdefinierten Überschrift kaskadiert automatisch: Jeder Vermögenswert unter dem alten Namen wird aktualisiert, sodass nichts verwaist zurückbleibt.
Drag-Sortierung innerhalb einer Überschrift
① Lange drücken zum Aufnehmen (haptisches Feedback). ② Nach oben oder unten ziehen. ③ Loslassen zum Ablegen.
Drücken Sie lange auf eine Vermögenszeile und ziehen Sie, um sie innerhalb ihrer Überschrift neu zu ordnen. Die Reihenfolge wird pro Vermögenswert über eine sort_order-Spalte gespeichert — Ihre bevorzugte Reihenfolge bleibt also über Sitzungen und Geräte hinweg erhalten. Das Ziehen zwischen Überschriften ist nicht erlaubt; ändern Sie stattdessen die Überschrift über den Bearbeiten-Bildschirm.
Der Ziehgriff erscheint am rechten Rand jeder Zeile nur, wenn der Abschnitt ausgeklappt ist. Haptisches Feedback wird beim Aufnehmen und Ablegen ausgelöst, um die Aktion zu bestätigen.
Unterabschnitte pro Eigentümer
① Überschrift mit aktivierter Eigentümer-Aufteilung. ② Eigentümer-Unterüberschrift mit Zwischensumme. ③ Zeilen, die diesem Eigentümer gehören.
Wenn Sie das Nettovermögen als Paar oder Haushalt verfolgen, kann FirePath einzelne Überschriften nach Eigentümer aufteilen. Fügen Sie zuerst jede Person unter Einstellungen → App-Listen → Eigentümer hinzu. Öffnen Sie dann Einstellungen → App-Listen → Vermögensüberschriften (oder Verbindlichkeitsüberschriften) und tippen Sie auf die Überschrift, die Sie aufteilen möchten — bei jeder gibt es einen Umschalter "nach Eigentümer aufteilen". Der Umschalter gilt pro Überschrift, Sie könnten also Super und Investments aufteilen (wo Konten individuell gehören), aber Immobilien und Bargeld nicht aufgeteilt lassen (gemeinsame Haushaltsvermögen).
Das Ergebnis: Innerhalb jeder aktivierten Überschrift sehen Sie eine Mini-Unterüberschrift pro Eigentümer mit einer Zwischensumme, dann die Vermögenswerte, die diesem Eigentümer gehören. Vermögenswerte ohne zugewiesenen Eigentümer fallen in eine Gruppe Nicht zugewiesen am Ende.
Dies ist eine der beliebtesten Funktionen von FirePath für Familien. Die Aufteilung ist reine Anzeige — alle Summen laufen weiterhin zur Haushaltszahl auf. Benennen Sie später einen Eigentümer um, und die Umbenennung kaskadiert durch jeden Vermögenswert, jede Verbindlichkeit, jede Einnahme und jede Ausgabe, die ihn referenzieren.
Der Zeitraum-Änderungs-Chip
① Der Zeitraum-Chip wechselt 1m → 3m → 6m → 12m je nach verfügbarem Verlauf.
Direkt unter der Tab-Zeile (Vermögenswerte / Verbindlichkeiten / Verlauf) zeigt ein kleiner Chip, wie stark sich Ihr Nettovermögen im jüngsten Zeitraum verändert hat — grün bei Anstieg, rot bei Rückgang. Der Chip ist hier intelligenter als auf dem Dashboard: Er folgt dem Tab, und auf dem Verlauf-Tab folgt er auch der Zeitraum-Auswahl.
Vermögenswerte- / Verbindlichkeiten-Tab — immer 1-Monats-Änderung
Verlauf-Tab, 1m-Bereich — 1-Monats-Änderung
Verlauf-Tab, 3m / 6m / 1J-Bereich — 3-/6-/12-Monats-Änderung (geht durch Ihre Momentaufnahmen zurück, um die älteste innerhalb dieses Fensters zu finden)
Verlauf-Tab, Alle-Bereich — kein Chip (die Differenz zur allerersten Momentaufnahme ist auf einen Blick nicht nützlich)
Wenn Sie FirePath erst seit 4 Monaten nutzen, zeigt der 6-Monats-Bereich trotzdem einen Chip an — er verwendet die älteste verfügbare Momentaufnahme (4m) und beschriftet sich entsprechend.
Das Monatsaufnahme-System — Einrichten und vergessen
Dies ist die Funktion, die FirePath von "einem Portfolio-Rechner" in einen langfristigen Vermögens-Tracker verwandelt. Jeden Monat schreibt die App lautlos eine Momentaufnahme Ihres vollständigen Finanzbilds — Gesamt-Nettovermögen, Investment-Nettovermögen, Gesamtvermögen, Gesamtverbindlichkeiten, Einnahmen, Ausgaben, abgeleitete Zahlen. Mit der Zeit werden diese Momentaufnahmen zu Ihrem Verlaufsdiagramm und treiben jeden Vergleich der App an (der monatliche Änderungs-Chip, die Zeitraum-Chips, die Fortschrittsbalken).
Sie müssen nichts tun. Sobald Ihre Vermögenswerte und Verbindlichkeiten eingegeben sind, übernimmt FirePath den Rest:
Preise aktualisieren sich automatisch alle 15 Minuten, während die App geöffnet ist, plus einem periodischen Hintergrund-Worker, wenn sie geschlossen ist (Premium: Automatische Kurse). Ticker-basierte Bestände bleiben aktuell, ohne dass Sie Alle abrufen tippen.
Momentaufnahmen werden automatisch geschrieben, wenn die App in einem neuen Kalendermonat geöffnet wird, und wenn der Hintergrund-Preis-Worker erfolgreich ausgelöst wird. Ihr Verlaufsdiagramm baut sich selbst auf.
Alle Summen werden automatisch neu berechnet, wenn sich ein zugrunde liegender Wert ändert — Vermögenssalden, Schuldensalden, Mengen, Kurse, Markierungen. Keine "Neu berechnen"-Schaltfläche; es ist immer live.
Momentaufnahmen liegen auf Ihrem Gerät. Aktivieren Sie die automatische Google Drive-Sicherung (Premium), und sie werden täglich verschlüsselt dorthin repliziert.
Was, wenn ich die App einen Monat lang nicht öffne?
Ehrliche Antwort: Android wird aggressiv, wenn es darum geht, Hintergrundarbeit für Apps zu pausieren, die eine Weile nicht geöffnet wurden. Wenn Sie FirePath ~5-7 Tage nicht öffnen, kann der periodische Preisabruf-Worker aufhören zu feuern (Doze-Modus, App-Standby und Herstelleroptimierungen insbesondere bei Xiaomi / Huawei). In diesem Fall:
Ihre Vermögenswert-Kurse wurden nicht im Hintergrund aktualisiert — sie werden beim nächsten Öffnen der App aktualisiert.
Eine Monatsende-Momentaufnahme kann ausgefallen sein — die App schreibt die nächste Momentaufnahme, wenn Sie sie schließlich wieder öffnen, und verwendet dabei die aktuellen Werte für den aktuellen Monat. Die Monatsende-Momentaufnahme des letzten Monats ist weg.
Drei Wege, dies zu vermeiden:
Öffnen Sie die App mindestens einmal pro Woche. 10 Sekunden für einen Blick aufs Dashboard halten den Hintergrund-Worker glücklich am Leben.
Fügen Sie das Home-Screen-Widget hinzu. Es aktualisiert alle 4 Stunden, was die App kurz aufweckt und den Worker registriert hält.
Wenn Sie einen Monat verpassen und das Diagramm vollständig haben möchten, fügen Sie manuell einen historischen Eintrag unter Nettovermögen → Verlauf-Tab hinzu. Sie wählen das Jahr-Monat und geben den Nettovermögen-Wert ein; er wird in die Momentaufnahmen-Reihe eingefügt.
Manuelle historische Einträge
① Monatliche Auto-Momentaufnahmen. ② Manuelle historische Einträge, die Sie hinzugefügt haben. ③ Zeitraum-Chips: 1m / 3m / 6m / 1J / Alle.
Haben Sie FirePath erst entdeckt, als Sie schon 3 Jahre getrackt haben? Der Verlauf-Tab hat eine Schaltfläche "Historischen Eintrag hinzufügen", mit der Sie eine Nettovermögen-Zahl für jedes vergangene Jahr-Monat eingeben können. Diese manuellen Einträge werden in die Momentaufnahmen-Reihe eingefügt und im Diagramm dargestellt. Wenn Sie Beide Nettovermögen verfolgen aktiviert haben, können Sie sowohl Gesamt- als auch Investment-Nettovermögen eingeben; andernfalls füllen Sie nur das aktive aus, und die andere Spalte wird zur Übereinstimmung aufgefüllt.
In Investment-Nettovermögen einbeziehen (bei jedem Vermögenswert)
Jeder Vermögenswert hat einen Umschalter In Investment-Nettovermögen einbeziehen. Standardmäßig an. Schalten Sie ihn für persönlich genutzte Gegenstände aus (Hauptwohnsitz, Auto, Sammlerstücke), die Sie nicht in Ihrem Investment-Nettovermögen mitzählen möchten.
Diese Markierung steuert auch, ob der Vermögenswert zur Prognose des FIRE-Rechners beitragen darf — denn FIRE geht grundsätzlich darum, was Ihren Ruhestand finanzieren kann, nicht darum, was Sie zufällig besitzen.
Machen Sie es zu Ihrem — Einstellungen, die diesen Bildschirm beeinflussen
Vermögensüberschriften und Verbindlichkeitsüberschriften — Einstellungen → App-Listen. Die integrierten Überschriften können neu geordnet oder ausgeblendet werden. Um einen Namen zu verwenden, den die App nicht mitliefert, fügen Sie Ihren eigenen hinzu — Ihre benutzerdefinierten Überschriften können frei umbenannt und gelöscht werden.
Anlageklassen — Einstellungen → App-Listen → Anlageklassen. Die Liste der Vermögenstypen, die die App mitliefert (Aktie, ETF, Krypto, Managed Fund, Immobilie, Bargeld, Edelmetall, Sonstiges). Ordnen Sie die integrierten neu oder blenden Sie sie aus; fügen Sie eigene Typen für ungewöhnliche Bestände hinzu (z. B. "Angel-Investment", "Private Equity", "Kunst"). Benutzerdefinierte Typen sind vollständig umbenennbar.
Börsen — Einstellungen → App-Listen → Börsen. Steuert, welche Aktienmärkte auf dem Bildschirm "Vermögenswert hinzufügen" für ticker-basierte Bestände erscheinen (ASX, US, LSE, EU/Xetra plus virtuelle Börsen CRYPTO und SPOT für Edelmetalle). Blenden Sie die aus, die Sie nicht nutzen; fügen Sie eigene hinzu, wenn Sie an einem Markt handeln, den FirePath nicht standardmäßig abdeckt.
Eigentümer — Einstellungen → App-Listen → Eigentümer. Fügen Sie hier Haushaltsmitglieder hinzu; dann kann jeder Vermögenswert/jede Verbindlichkeit einem zugewiesen werden.
Nach Eigentümer aufteilen — jede Vermögens- und Verbindlichkeitsüberschrift hat einen eigenen Umschalter "nach Eigentümer aufteilen", sodass Sie mixen und kombinieren können. Nur aktiv, wenn Eigentümer aktiviert sind und Sie ≥2 Eigentümer haben.
Gesamt-Nettovermögen anzeigen / Beide Nettovermögen verfolgen — steuert, welche Nettovermögen-Zahl angezeigt wird und ob beide bei jeder Momentaufnahme gespeichert werden.
Monats- vs. Jahresbalken
Unter dem Verlaufsdiagramm erscheint eine Liste von Veränderungsbalken — einer pro Zeitraum, grün für Zuwächse, rot für Rückgänge. Mit dem Chip darüber wechselst du zwischen Monat (ein Balken pro Snapshot-Intervall, z. B. 2026-03) und Jahr (ein Balken pro Kalenderjahr; das laufende Jahr wird als 2026 YTD angezeigt). Die Jahresansicht ist der schnellste Weg, um auf einen Blick zu sehen, wie 2024 im Vergleich zu 2025 abgeschnitten hat.
Hinweis bei spärlichen Daten: Ein Jahresbalken summiert die Veränderungen zwischen Snapshots, deren späteres Enddatum in dieses Jahr fällt. Wenn deine Snapshot-Historie ein Kalenderjahr nicht vollständig abdeckt, repräsentiert der Balken nur den tatsächlich erfassten Teilzeitraum — die Monatsansicht bleibt die fein aufgelöste Wahrheitsquelle.