The Dashboard: every card explainedDas Dashboard: jede Karte erklärt
Every card on the Dashboard explained: the big net-worth number, the monthly-change chip, the passive-income card, the total-cash liquid opt-in, and the tablet-landscape asset-allocation donut.Jede Karte auf dem Dashboard erklärt: die große Nettovermögen-Zahl, der Monatsänderungs-Chip, die Karte für passives Einkommen, die Gesamtbargeld-Opt-in-Option für liquides Vermögen und der Vermögensaufteilungs-Donut im Tablet-Querformat.
{# Hero image is rendered twice — once for each locale — and one is
hidden by the lang toggle. The DE copy lives in a /de/ subfolder
under the same slug; we strip the trailing "hero.png" and re-add
"de/hero.png" so we don't need a custom template filter. Pattern
assumes hero_image_filename is always "/hero.png", which is
the convention enforced by the seed migrations. #}
Quick start
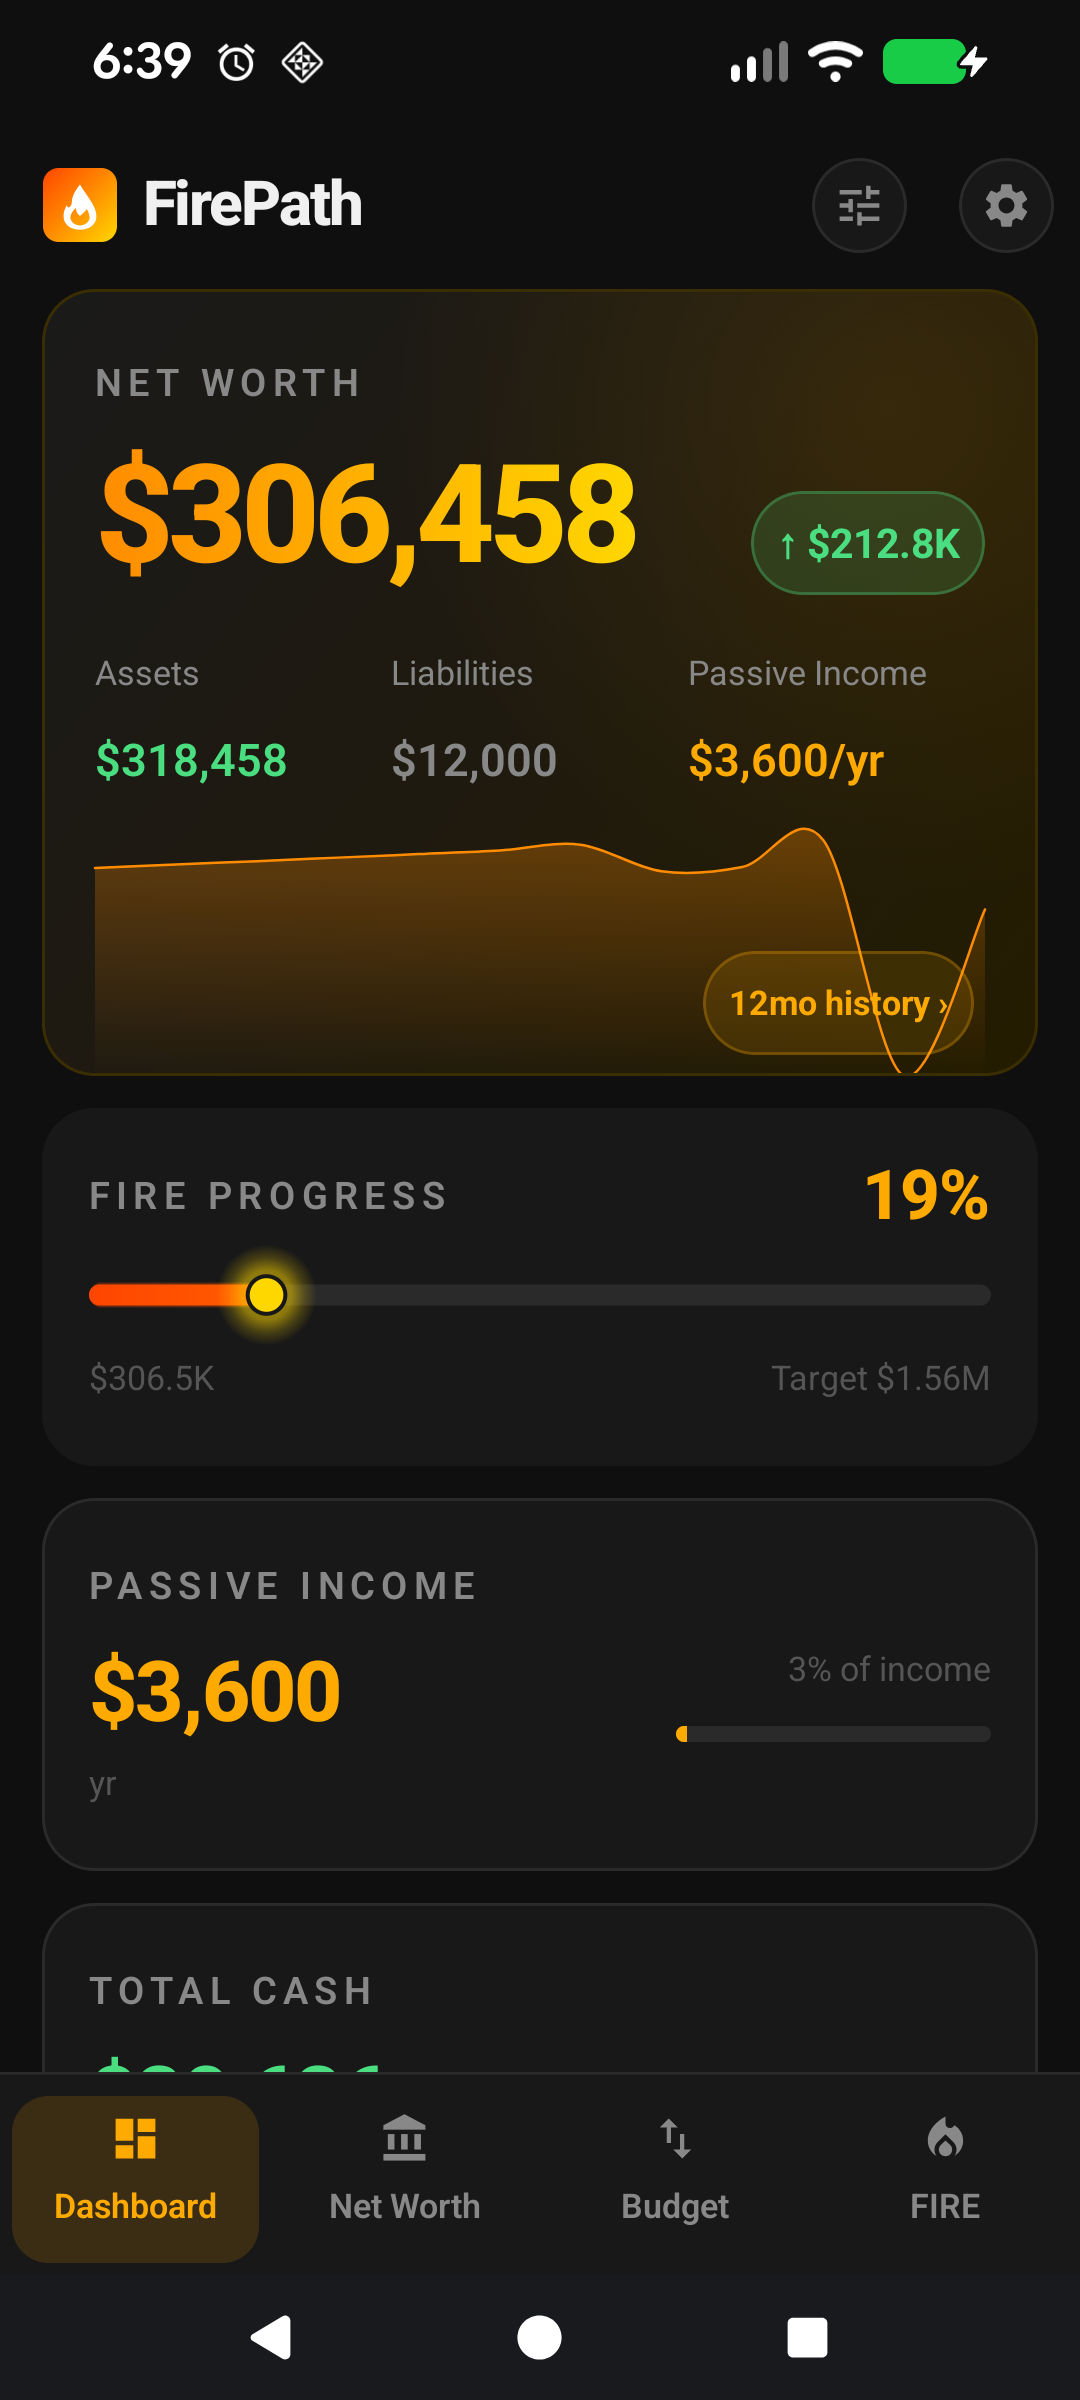
The Dashboard is FirePath's at-a-glance financial picture. Open the app, and this is the first screen you see.
The big number at the top is your net worth — assets minus liabilities.
The small amber chip next to it shows how much that number has moved in the last month.
Cards below summarise passive income, total cash, a mini FIRE progress bar, and (on premium) asset allocation.
Tap a card to jump to the screen where that data lives — the 12mo history chip on the net-worth card drops you straight onto the Net Worth History tab pre-filtered to 1 year.
That's all you need to start. The rest of this page is for users who want to tune what shows up and how.
The rest of this guide is for users who want to tune the screen. If you're happy with the defaults, you can stop here — everything below is optional customisation.
Going deeper
The monthly-change chip
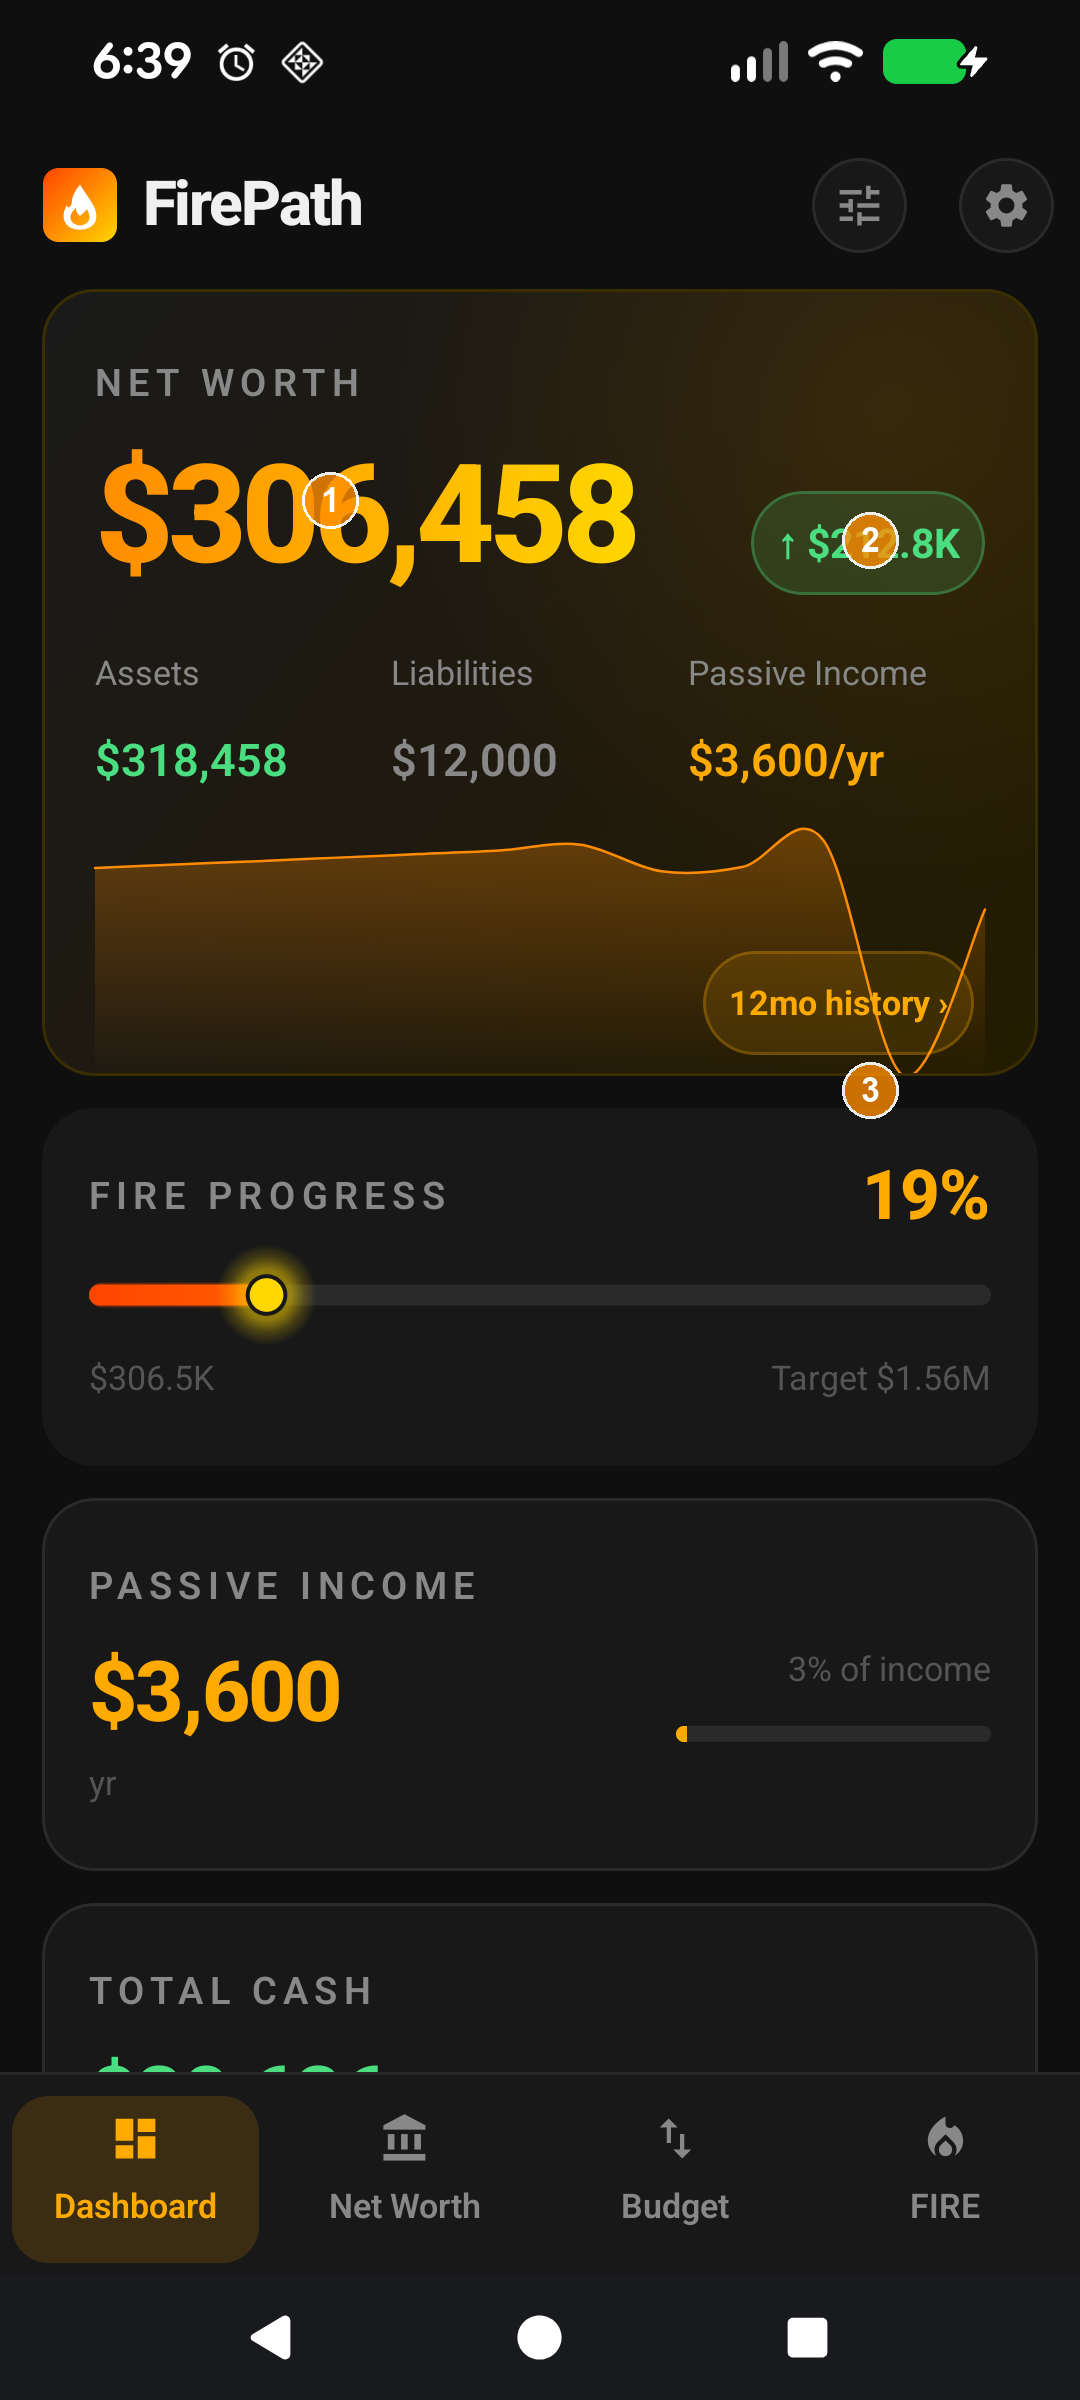
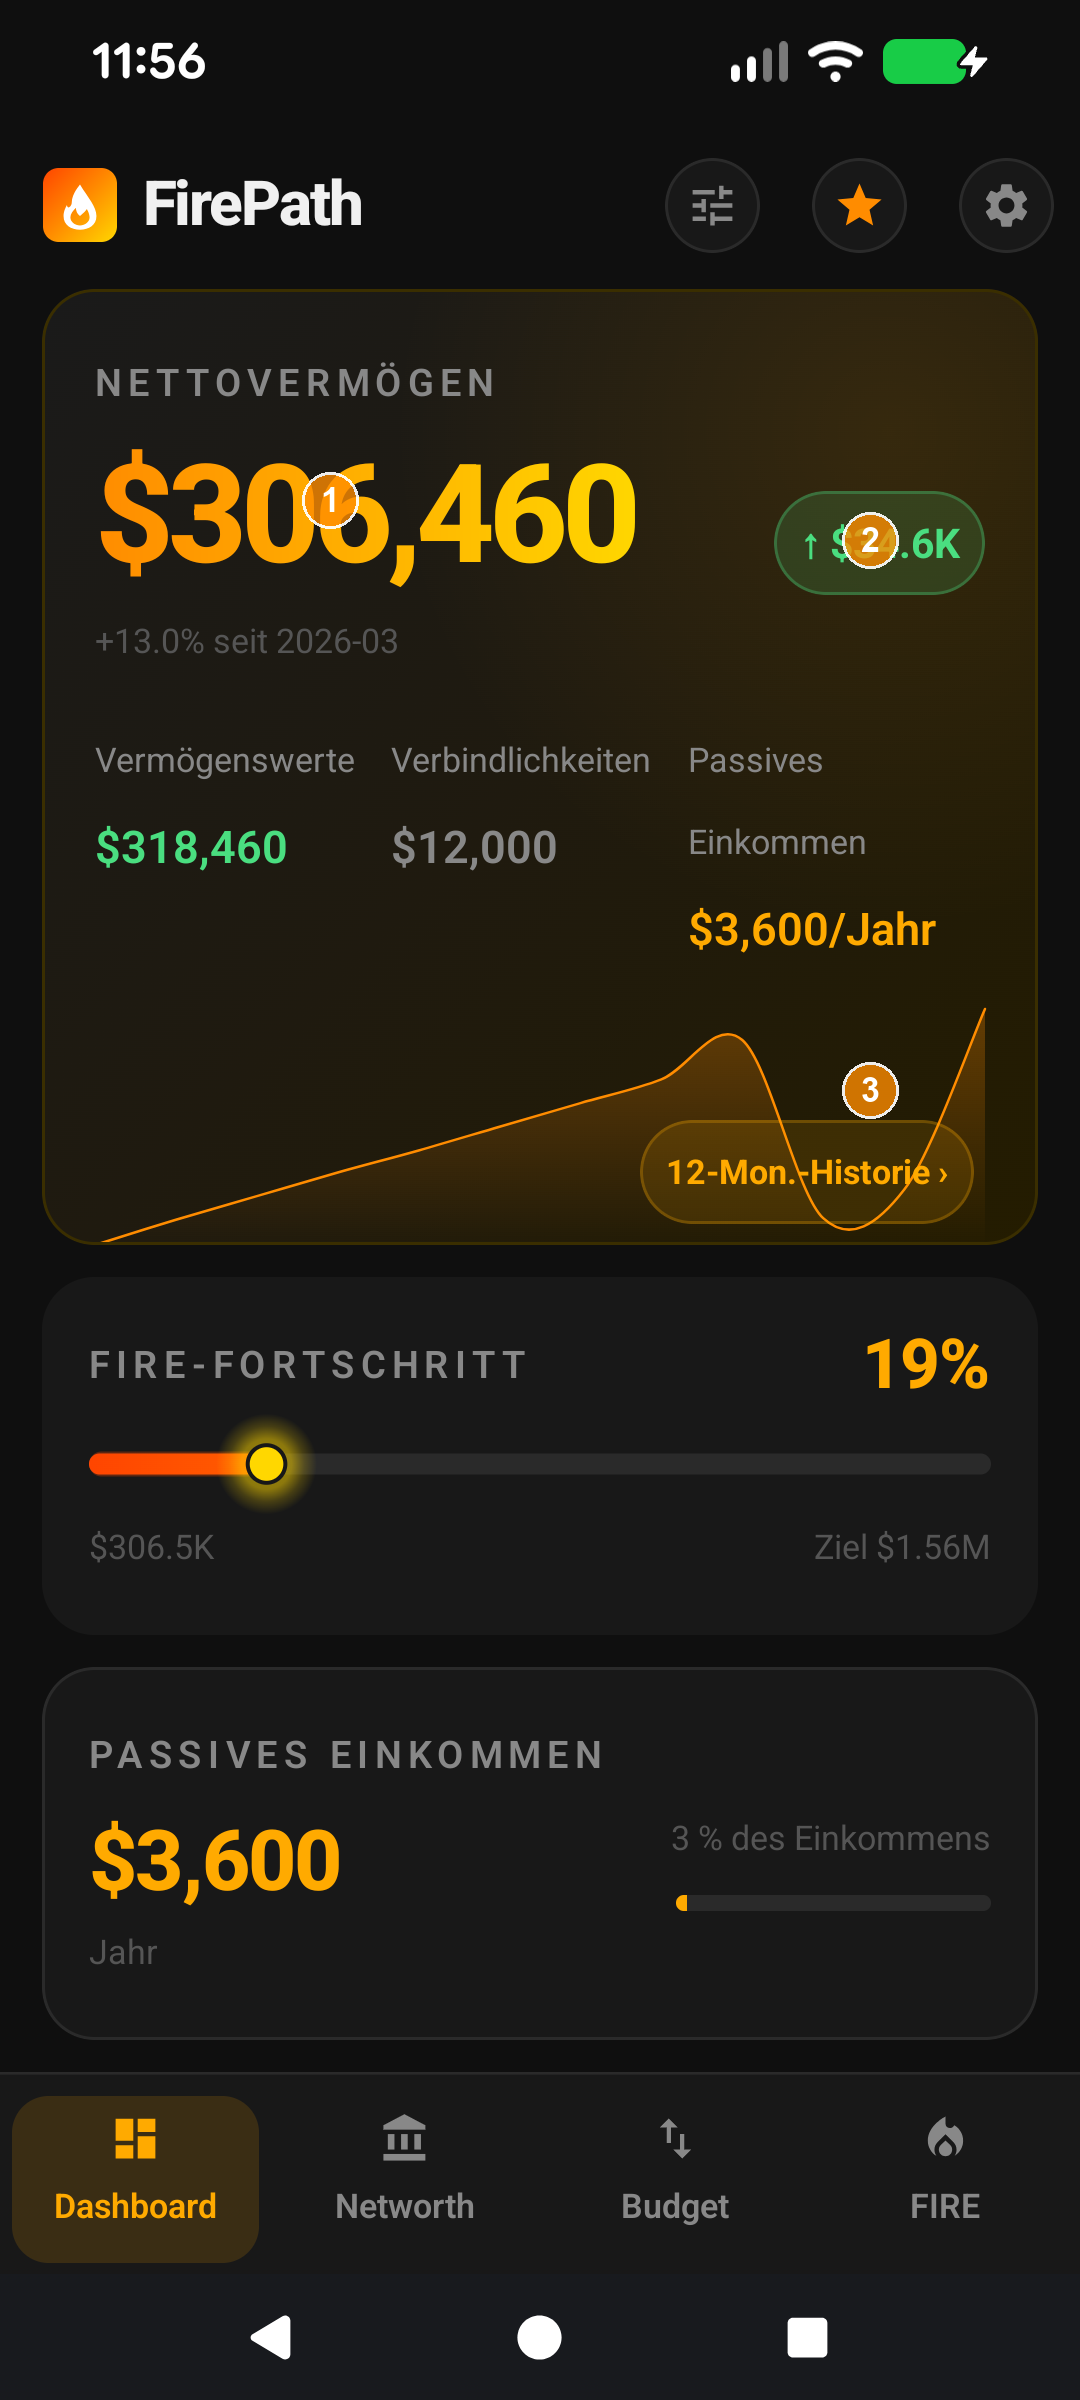
① Net-worth number. ② Monthly-change chip. ③ 12mo history chip. ④ Total vs Investment NW toggle.
The small amber chip on the right of the big number shows the delta between your latest monthly snapshot and the one before. It's colour-coded: green with an up arrow for positive movement, red with a down arrow for negative.
Snapshots are created automatically on the 1st of each month the first time you open the app that month, so the chip always reflects the last full month versus the current running total. If you're new to FirePath and only have one snapshot, the chip stays hidden until you have two to compare.
The 12mo history chip
Below the big number sits a small "12mo history" chip. Tap it to jump straight to the Net Worth screen's History tab, pre-filtered to the 1-year range. Quicker than navigating via the bottom bar and manually picking the range.
Investment vs Total Net Worth
Investment NW only counts assets flagged Include in Investment NW. A primary residence, a car, personal-use collectibles — these typically aren't counted because they don't fund retirement. Debts tied to those assets (e.g. the mortgage on your home) also drop out of the Investment NW calculation when their Is Investment flag is off.
Switch between the two via Settings → Display → Show Total Net Worth. Or enable Track Both Net Worths to have the app store both figures on every snapshot so you can flip freely without losing history.
The Passive Income card
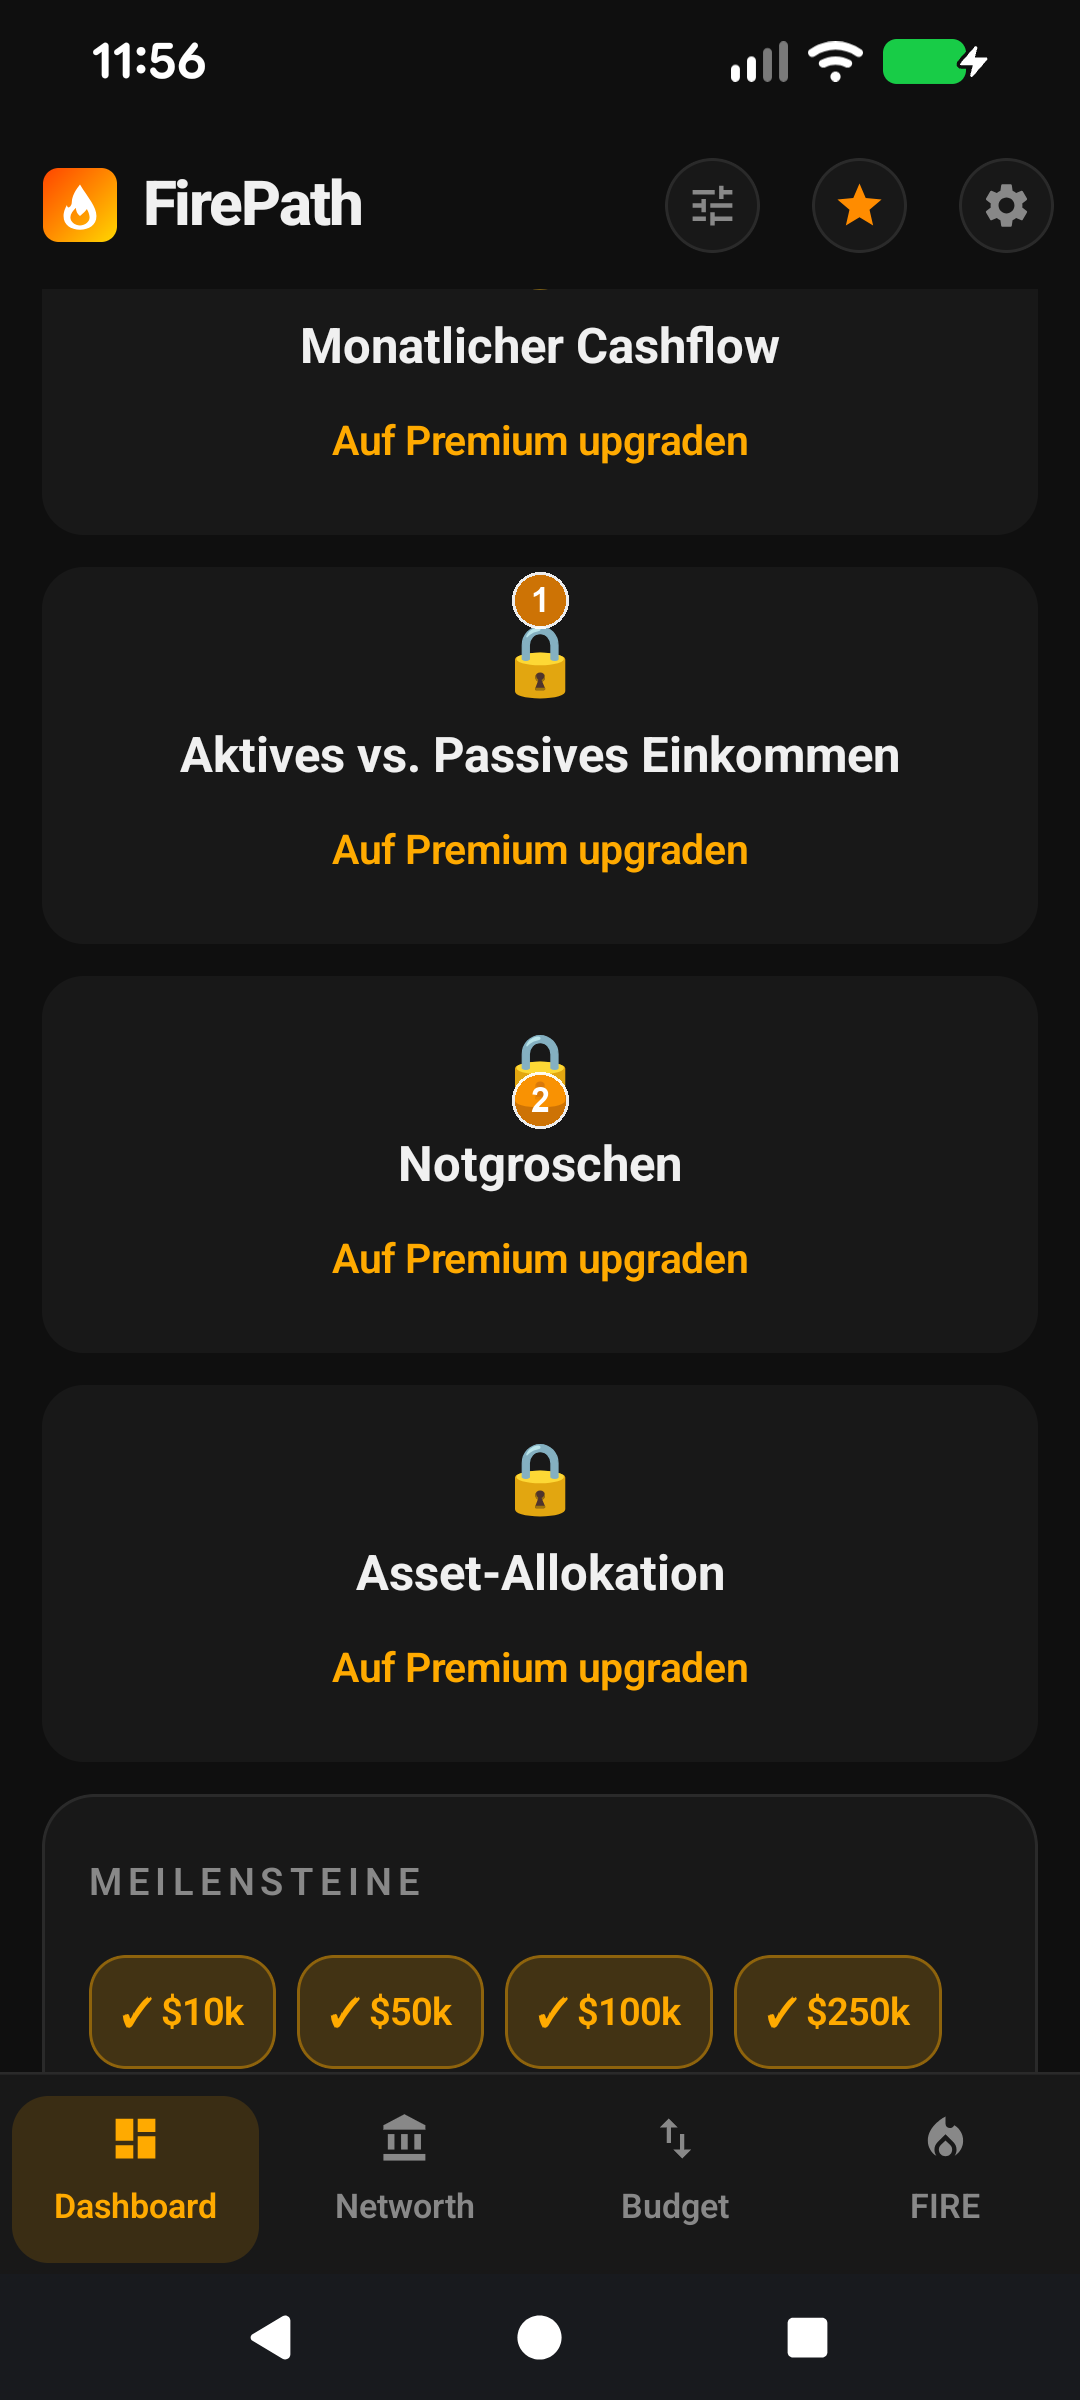
① Passive Income. ② Monthly Cash Flow.
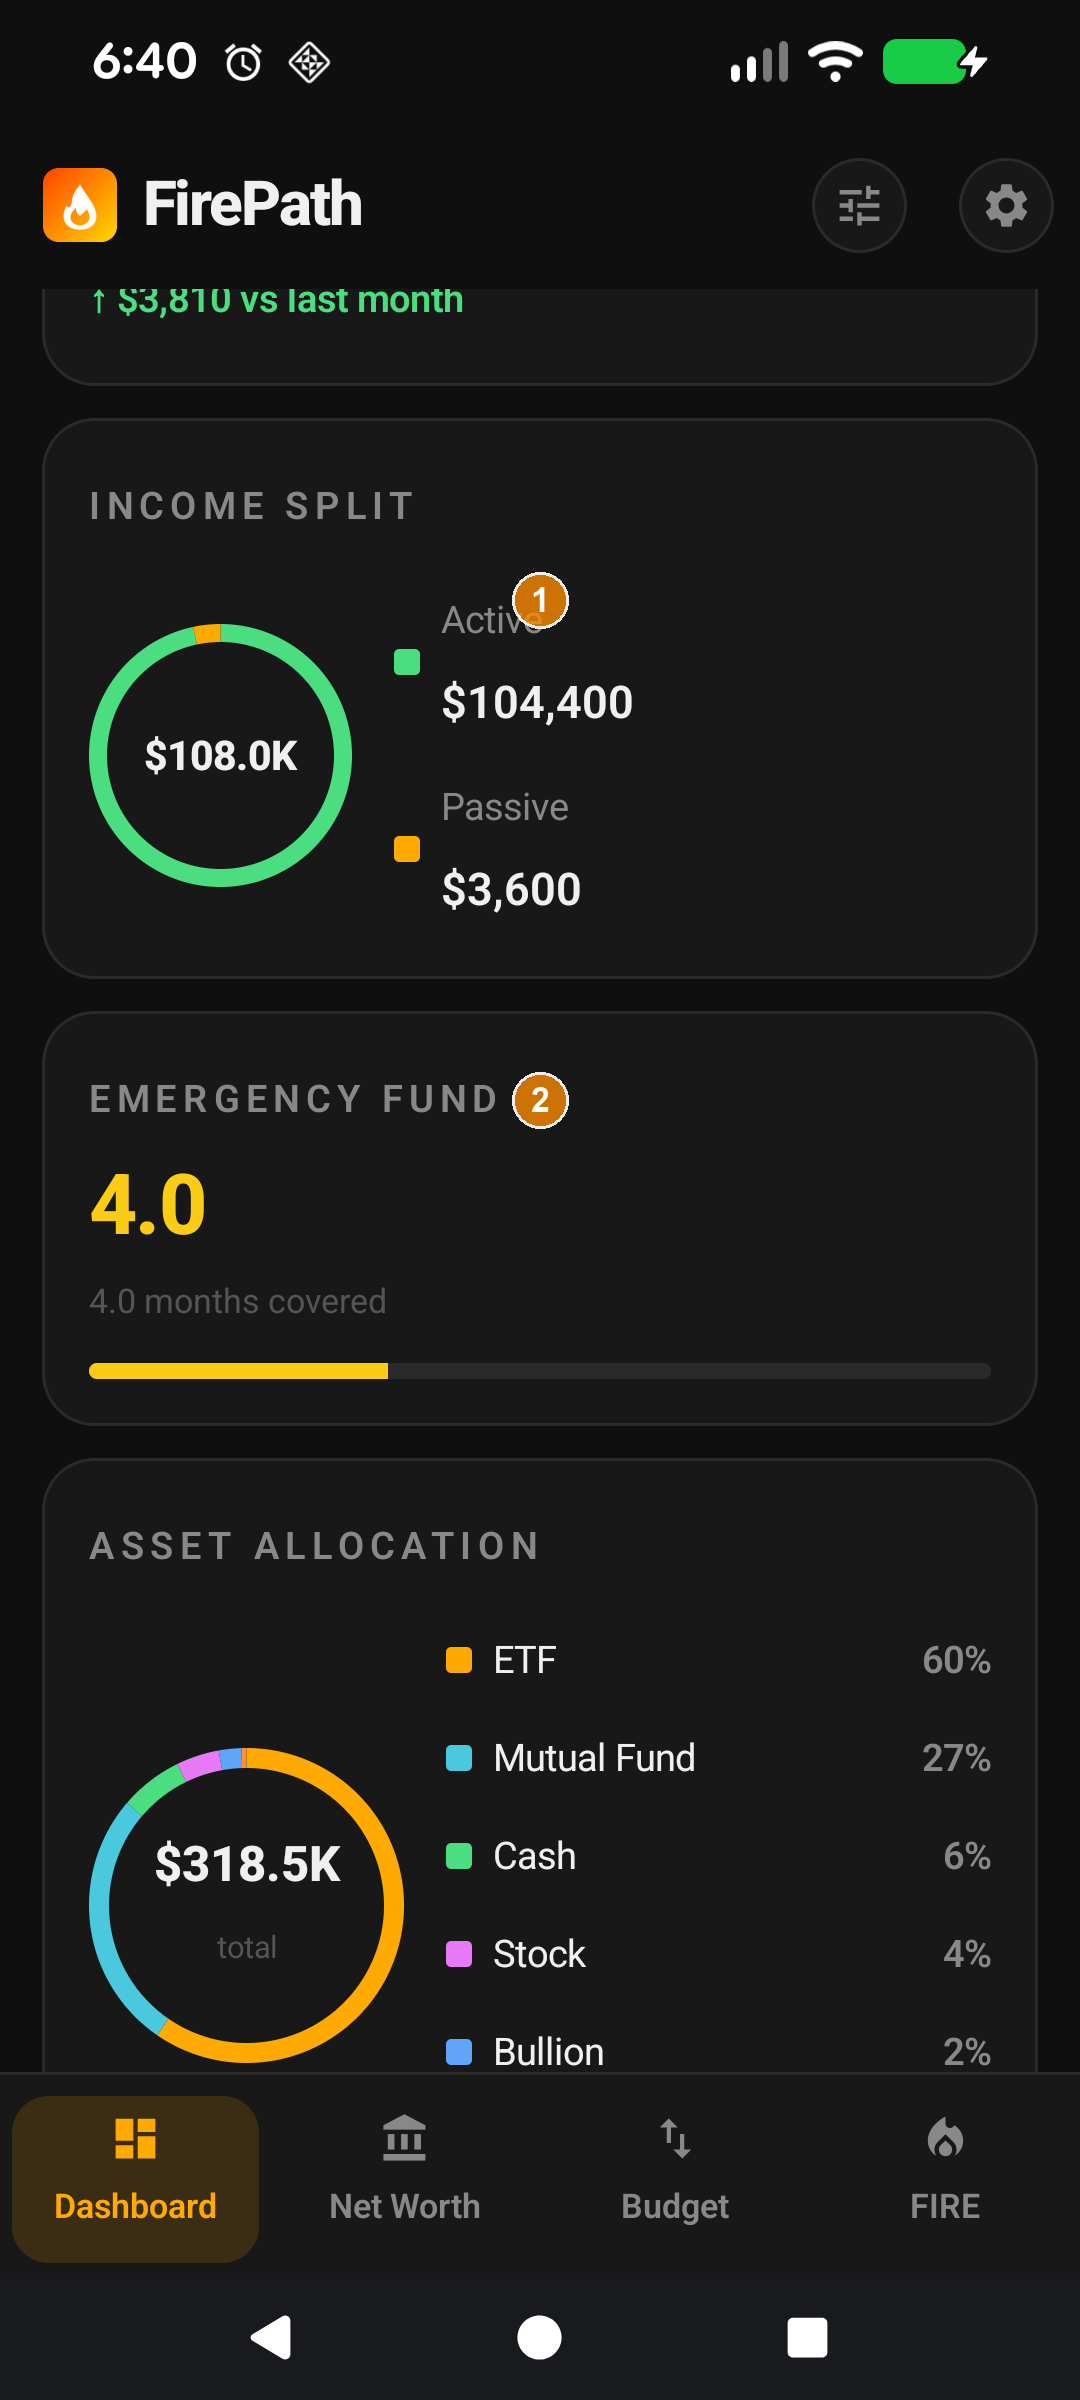
Sums every income item where Passive is ticked. Rental income, dividends, distributions — tick them as passive and they show up here. Everything else is classed as active income. The card makes it trivial to see what percentage of your income arrives whether you work or not — one of the most useful FIRE metrics.
The Total Cash card
① Cash asset inside Super. ② Include in Liquid Cash toggle — on for retirees, off for younger users.
Shows the liquid cash you could access tomorrow. By default this includes bank accounts and any asset with type CASH. But the real magic is the per-asset Include in Liquid Cash toggle, which lets you opt in cash-type assets held inside a Super fund. For retirees or those approaching preservation age, Super cash is liquid; for younger users it isn't. The toggle respects that distinction without forcing a global rule.
Asset Allocation (tablet landscape)
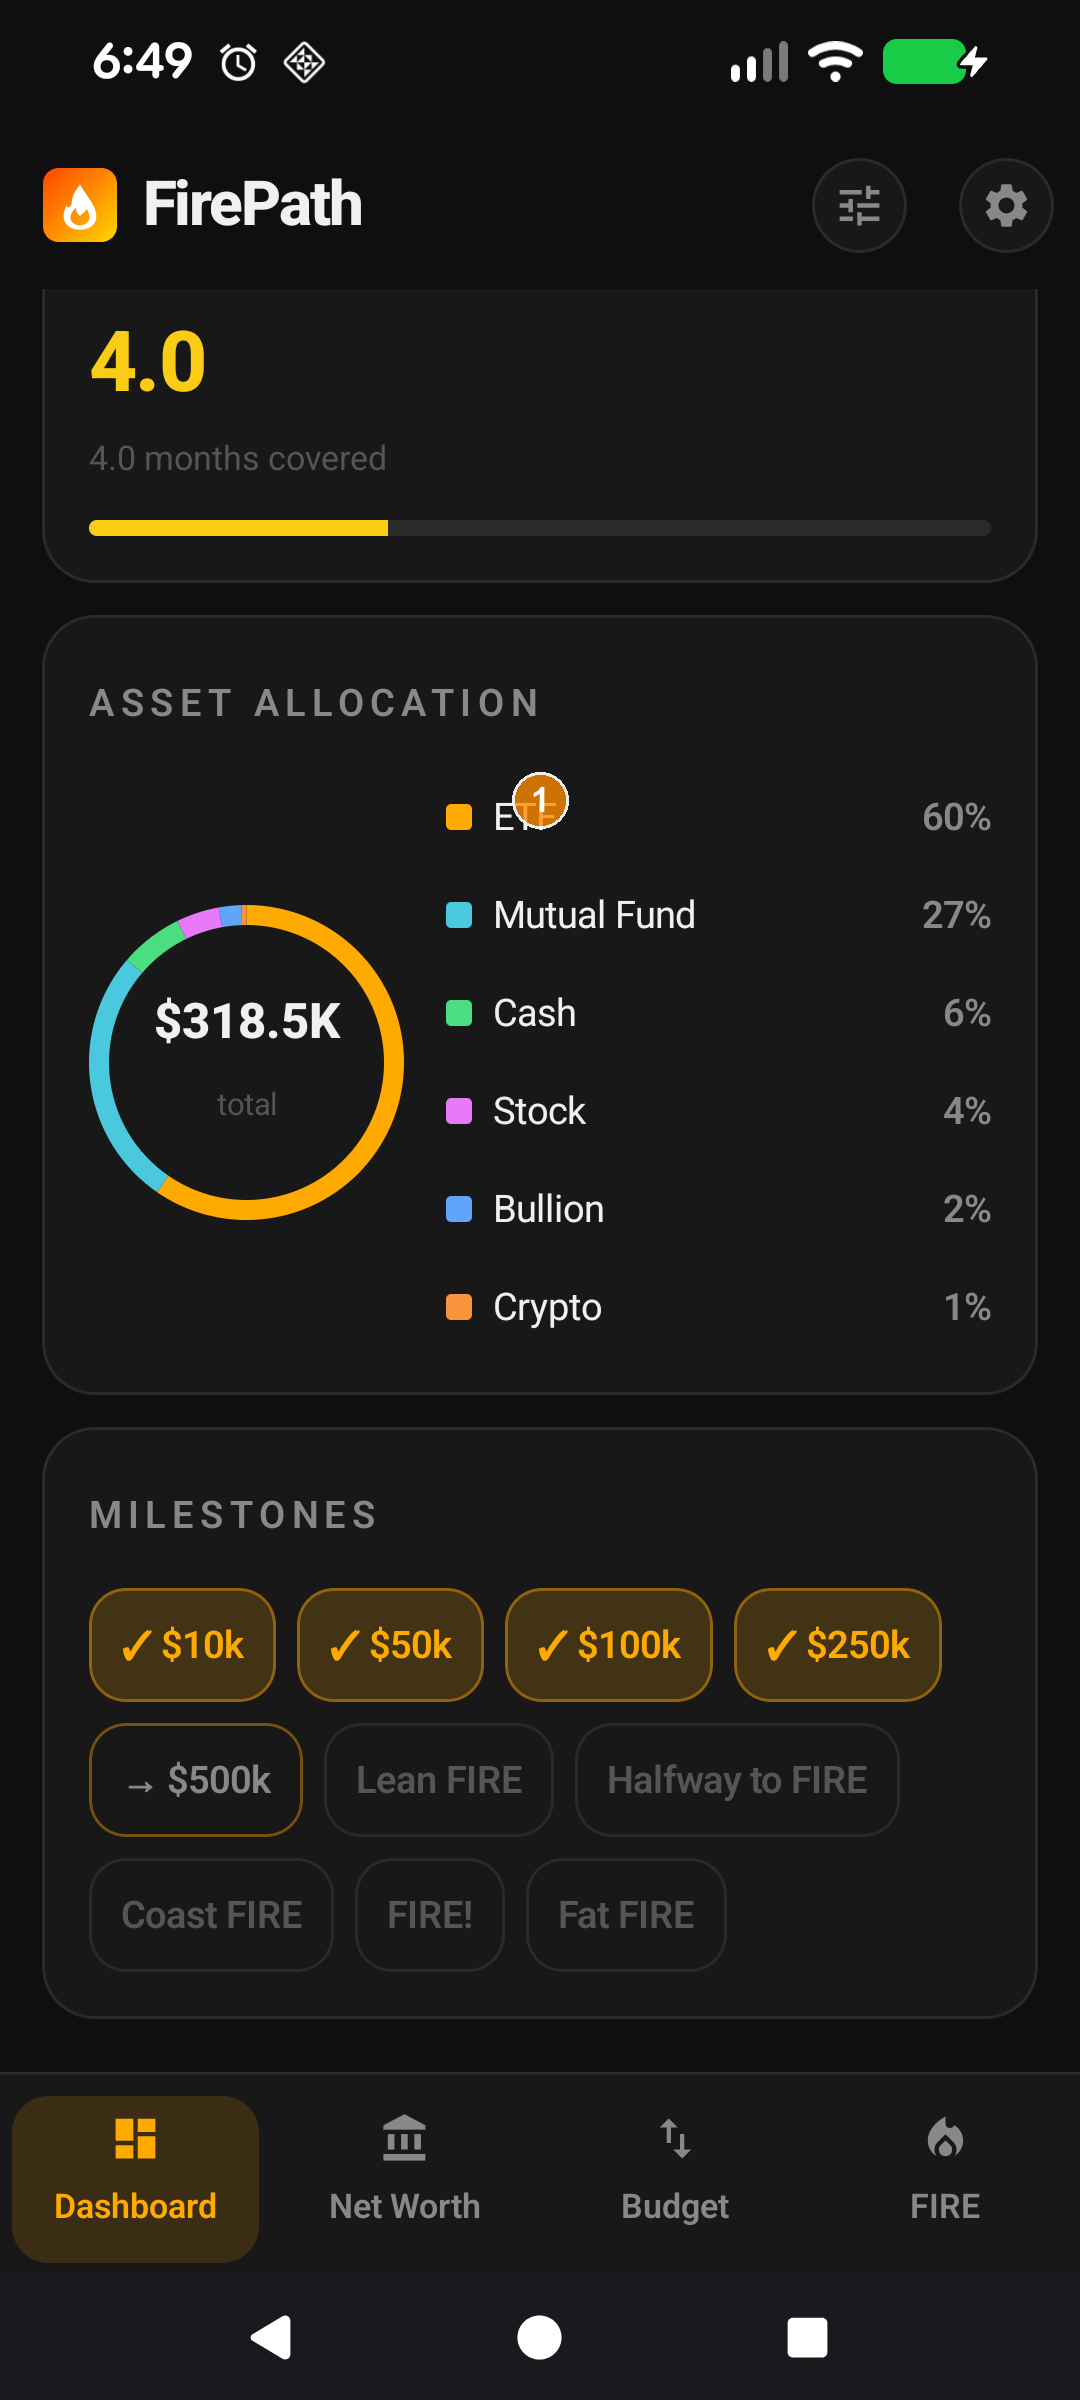
① Allocation donut showing your asset mix (Stocks / Super / Cash / Property / Crypto / Bullion).
On tablet-landscape layouts, the hero pairs with a donut chart showing your investment allocation by asset type. Free users see a preview with an upgrade button; premium users get the full breakdown. The donut respects the same Investment vs Total toggle as the hero card.
Hiding cards you don't use
Settings → App Lists → Dashboard Cards shows every Dashboard card with a visibility toggle and a drag handle. Drag to reorder, toggle off to hide. Changes take effect immediately; no restart needed. Cards that are hidden don't run their underlying calculations, so hiding unused cards also saves a tiny bit of battery on every app open.
Make it yours — Settings that affect this screen
Show Total Net Worth — toggle between Investment NW (excludes your primary residence, car, personal-use assets) and Total NW (every asset minus every liability). Investment NW is the default because it reflects the wealth that can actually fund retirement.
Track Both Net Worths — when on, manual history entries capture both figures so the Progress chart can show both series.
Dashboard cards — Settings → App Lists → Dashboard Cards lets you hide cards you don't care about and drag-reorder the rest. The card list is fully user-defined.
Collapse top cards — auto-collapses the hero to save vertical space on phones; pull down to re-expand.
Schnellstart
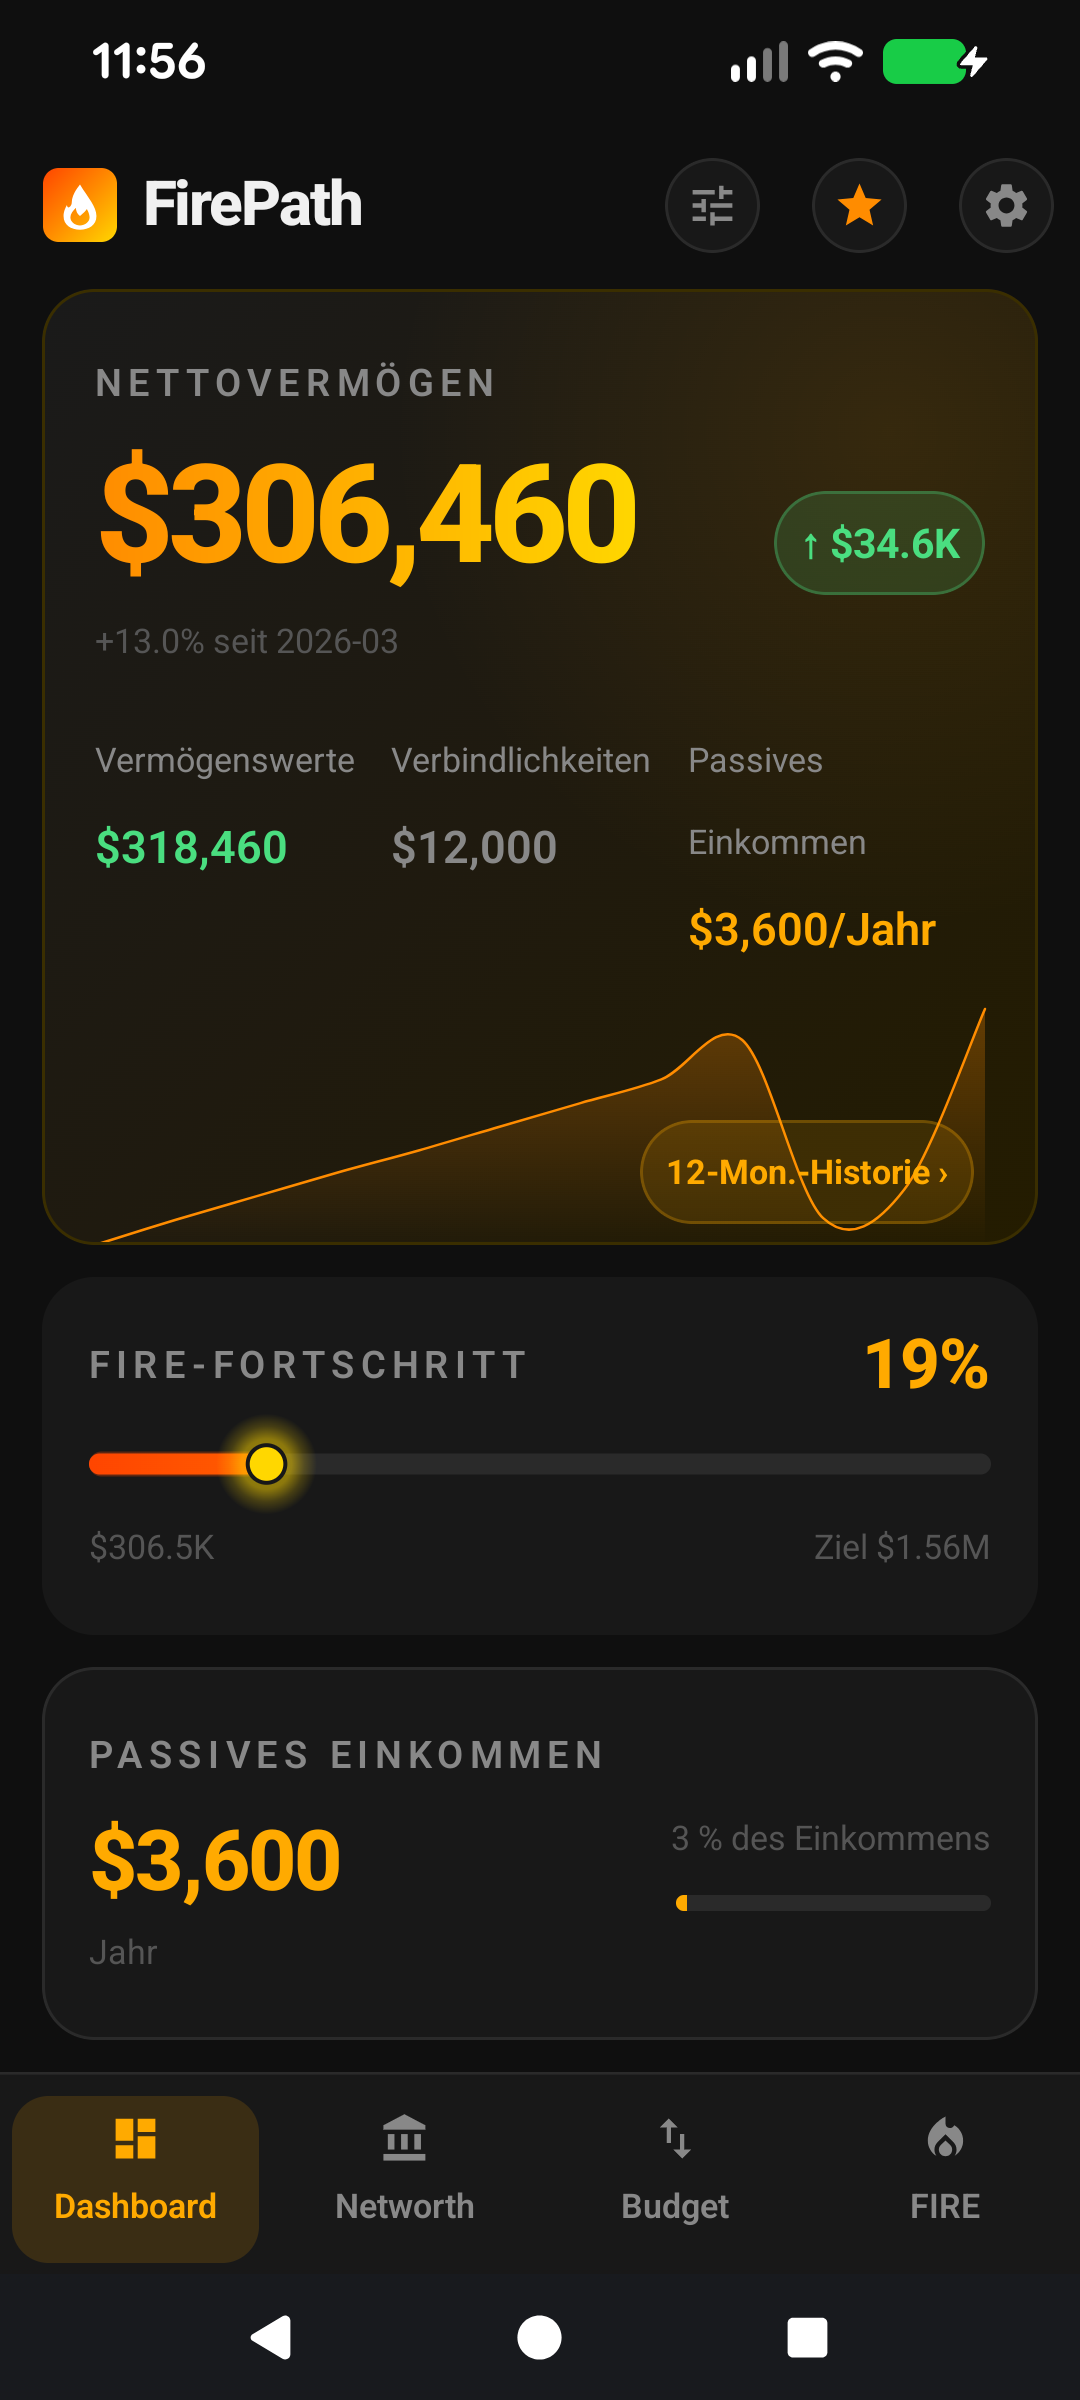
Das Dashboard ist FirePaths Finanzüberblick auf einen Blick. Öffnen Sie die App, und dies ist der erste Bildschirm, den Sie sehen.
Die große Zahl oben ist Ihr Nettovermögen — Vermögenswerte minus Verbindlichkeiten.
Der kleine orangefarbene Chip daneben zeigt, wie stark sich diese Zahl im letzten Monat verändert hat.
Die Karten darunter fassen passives Einkommen, Gesamtbargeld, einen kleinen FIRE-Fortschrittsbalken und (mit Premium) die Vermögensaufteilung zusammen.
Tippen Sie auf eine Karte, um zum Bildschirm zu springen, auf dem diese Daten leben — der 12-Monate-Verlauf-Chip auf der Nettovermögen-Karte bringt Sie direkt zum Tab Nettovermögen-Verlauf, vorgefiltert auf 1 Jahr.
Das ist alles, was Sie zum Starten brauchen. Der Rest dieser Seite ist für Nutzer, die einstellen möchten, was angezeigt wird und wie.
Der Rest dieser Anleitung ist für Nutzer, die den Bildschirm anpassen möchten. Wenn Sie mit den Standardeinstellungen zufrieden sind, können Sie hier aufhören — alles unten ist optionale Anpassung.
Tiefer eintauchen
Der Monatsänderungs-Chip
① Nettovermögen-Zahl. ② Monatsänderungs-Chip. ③ 12-Monate-Verlauf-Chip. ④ Umschalter zwischen Gesamt- und Investment-Nettovermögen.
Der kleine orangefarbene Chip rechts neben der großen Zahl zeigt die Differenz zwischen Ihrer letzten monatlichen Momentaufnahme und der vorherigen. Er ist farblich gekennzeichnet: grün mit Pfeil nach oben für positive Bewegung, rot mit Pfeil nach unten für negative.
Momentaufnahmen werden automatisch am 1. jedes Monats erstellt, wenn Sie die App in diesem Monat zum ersten Mal öffnen, sodass der Chip immer den letzten vollen Monat gegen die aktuelle Summe zeigt. Wenn Sie neu bei FirePath sind und nur eine Momentaufnahme haben, bleibt der Chip verborgen, bis Sie zwei zum Vergleichen haben.
Der 12-Monate-Verlauf-Chip
Unter der großen Zahl sitzt ein kleiner „12-Monate-Verlauf"-Chip. Tippen Sie darauf, um direkt zum Verlauf-Tab des Nettovermögen-Bildschirms zu springen, vorgefiltert auf den 1-Jahres-Bereich. Schneller als die Navigation über die untere Leiste und manuelle Bereichsauswahl.
Investment- vs. Gesamt-Nettovermögen
Das Investment-Nettovermögen zählt nur Vermögenswerte, die als In Investment-Nettovermögen einbeziehen markiert sind. Ein Hauptwohnsitz, ein Auto, persönliche Sammlerstücke — diese werden typischerweise nicht gezählt, da sie die Rente nicht finanzieren. Schulden, die an solche Vermögenswerte gebunden sind (z. B. die Hypothek auf Ihr Haus), fallen ebenfalls aus der Investment-Nettovermögen-Berechnung heraus, wenn ihre Ist Investment-Markierung ausgeschaltet ist.
Wechseln Sie zwischen beiden über Einstellungen → Anzeige → Gesamt-Nettovermögen anzeigen. Oder aktivieren Sie Beide Nettovermögen verfolgen, damit die App beide Zahlen in jeder Momentaufnahme speichert und Sie frei wechseln können, ohne den Verlauf zu verlieren.
Die Karte „Passives Einkommen"
① Passives Einkommen. ② Monatlicher Cashflow.
Summiert jeden Einkommensposten, bei dem Passiv angekreuzt ist. Mieteinnahmen, Dividenden, Ausschüttungen — markieren Sie sie als passiv und sie erscheinen hier. Alles andere wird als aktives Einkommen klassifiziert. Die Karte macht es trivial zu sehen, welcher Prozentsatz Ihres Einkommens ankommt, egal ob Sie arbeiten oder nicht — eine der nützlichsten FIRE-Kennzahlen.
Die Karte „Gesamtbargeld"
① Bargeld-Vermögenswert innerhalb von Super. ② Umschalter „In liquides Bargeld einbeziehen" — an für Rentner, aus für jüngere Nutzer.
Zeigt das liquide Bargeld, auf das Sie morgen zugreifen könnten. Standardmäßig umfasst dies Bankkonten und jeden Vermögenswert vom Typ BARGELD. Aber die eigentliche Magie ist der Umschalter In liquides Bargeld einbeziehen pro Vermögenswert, mit dem Sie Bargeld-Vermögenswerte einbeziehen können, die in einem Super-Fonds gehalten werden. Für Rentner oder solche, die sich dem Auszahlungsalter nähern, ist Super-Bargeld liquid; für jüngere Nutzer nicht. Der Umschalter berücksichtigt diese Unterscheidung, ohne eine globale Regel zu erzwingen.
Vermögensaufteilung (Tablet-Querformat)
① Aufteilungs-Donut, der Ihre Vermögensmischung zeigt (Aktien / Super / Bargeld / Immobilien / Krypto / Edelmetalle).
Auf Tablet-Querformat-Layouts ist das Hero-Element mit einem Donut-Diagramm gekoppelt, das Ihre Investment-Aufteilung nach Anlageklasse zeigt. Kostenlose Nutzer sehen eine Vorschau mit einem Upgrade-Button; Premium-Nutzer erhalten die vollständige Aufschlüsselung. Der Donut berücksichtigt denselben Umschalter zwischen Investment und Gesamt wie die Hero-Karte.
Karten ausblenden, die Sie nicht nutzen
Einstellungen → App-Listen → Dashboard-Karten zeigt jede Dashboard-Karte mit einem Sichtbarkeitsumschalter und einem Ziehgriff. Ziehen Sie, um neu zu ordnen, oder schalten Sie aus, um auszublenden. Änderungen wirken sofort; kein Neustart erforderlich. Ausgeblendete Karten führen ihre zugrunde liegenden Berechnungen nicht aus, sodass das Ausblenden unbenutzter Karten bei jedem App-Öffnen auch ein wenig Akku spart.
Machen Sie es zu Ihrem — Einstellungen, die diesen Bildschirm beeinflussen
Gesamt-Nettovermögen anzeigen — wechselt zwischen Investment-Nettovermögen (schließt Ihren Hauptwohnsitz, Auto und persönlich genutzte Vermögenswerte aus) und Gesamt-Nettovermögen (jeder Vermögenswert minus jede Verbindlichkeit). Investment-Nettovermögen ist der Standard, da es das Vermögen widerspiegelt, das tatsächlich die Rente finanzieren kann.
Beide Nettovermögen verfolgen — wenn aktiviert, erfassen manuelle Verlaufseinträge beide Zahlen, damit das Fortschrittsdiagramm beide Reihen zeigen kann.
Dashboard-Karten — Einstellungen → App-Listen → Dashboard-Karten lässt Sie Karten ausblenden, die Sie nicht interessieren, und den Rest per Drag & Drop neu ordnen. Die Kartenliste ist vollständig benutzerdefiniert.
Obere Karten einklappen — klappt das Hero-Element automatisch ein, um auf Telefonen vertikalen Platz zu sparen; ziehen Sie nach unten, um wieder zu erweitern.